QCA.news - Quad Cities news and view from both sides of the river
Monday, August 3rd, 2026 | |
 |  Des Moines man charged after driving off with missing Davenport childrenRay L. Eckholm of Des Moines faces charges after police say he took missing Davenport children on a reckless interstate ride before crashing. |
| |  Giannoulias becomes 2nd statewide officeholder running for Chicago mayorAlexi Giannoulias is joining a crowded field of candidates hoping to unseat incumbent Mayor Brandon Johnson, who has not said yet if he is a candidate for reelection. |
| | Muscatine High School hosting major public safety training exerciseExpect a large presence of emergency responders at Muscatine High School Monday afternoon as local agencies conduct public safety training. |
| |  Iowa businesses, unions form data center group aimed at responsible developmentThe bipartisan group “Growing Iowa’s Economy,” comprised of Iowa businesses, economic groups, unions and more, says it wants to promote the “responsible development of new data centers.” |
| |  Scam Alert in Dubuque CountyThe Dubuque County Sheriff’s Office is warning residents about a scam involving the families of arrested individuals. |
| | Inmate convicted of 1991 Scott County murder dies in prisonHarry Sisco, the inmate convicted of the brutal 1991 Scott County murder of Milan mother Audrey Elaine St. Clair, has died in an Iowa prison. |
 |  ImpactLife supports animal shelters for month of “Dogust”During the dog days of August, ImpactLife is partnering with animal shelters to encourage blood donors to support animal care in local communities. |
 | 3 Things to Know: Aug. 3, 2026Today's Three Things to Know: a Moline firefighter retirement, a Rock Island community survey and News 8's Roger Craig streaming special. |
 |  Washington wildfires destroy homes, force thousands to evacuateSpokane Mayor Lisa Brown says nearly half of the city's neighborhoods have either been evacuated or are at risk as the fires remain uncontained. |
| |  Area back-to-school dates for 2026-27 school yearKWQC has compiled a full list of Quad Cities area schools’ first-day-of-school dates in Iowa and Illinois. |
 | Clinton Fire battles weekend structure fireClinton firefighters responded to a report of a structure fire on Harts Mill Road on Saturday night. A news release from the Clinton Fire Department said firefighters were called to a structure fire in the 5400 block of Harts Mill Road on August 1 at about 6:37 p.m. Crews saw heavy smoke coming from the [...] |
| |  Putnam Museum hosts Marlee Matlin for film screening, keynote during Culture Bright seriesThe Putnam Museum will host Academy Award‑winner Marlee Matlin on Aug. 19 for a film screening, keynote address and the launch of new accessibility technology as part of the Culture Bright Summer Series. |
| |  Muscatine man faces charges of enticing, grooming, sex abuseJoseph Leaver of Muscatine faces multiple felony charges, including enticing a minor, and is being held in the Muscatine County Jail on $50,000 bond. |
| |  U.S. men's national team coach Mauricio Pochettino will stay through 2030 World CupPochettino came on in 2024 to right the ship ahead of this year's World Cup, in which he led the team to a record three wins and helped ignite enthusiasm in millions of fans before a round of 16 exit. |
| | Clinton Area Showboat Theatre to present 'Putnam County Spelling Bee'The Clinton Area Showboat Theatre will present "The 25th Annual Putnam County Spelling Bee" opening Thursday, Aug, 6, and running through Sunday, Aug. 16, a news release says. The production is directed by Clinton Area Showboat Associate Producer Ryan Scoble.Winner of two Tony Awards, including Best Book, "The 25th Annual Putnam CountySpelling Bee" is a [...] |
| |  Paint It Back will return to downtown ClintonPaint it Back is coming to downtown Clinton in 2026 starting a bold new chapter, a news release says. After three years of transforming a former anchor, now vacant building, in the Lyons District into a colorful open-air gallery, Paint it Back will take the public art movement to a new location in downtown Clinton. [...] |
| | Bureau Co. man accused in standoff that killed toddler due in court Mondayureau County man Anthony Rodriguez faces a status hearing Monday after a hostage standoff that tragically ended in a toddler's death last year. |
 | Against All Advice, Speaker Welch Stands Before a Mirror and Says “Michael Madigan” Three TimesHouse Speaker Emanuel “Chris” Welch promised the Chicago Teachers Union (CTU) last week that he will “lead” the effort to send more state money to Chicago Public Schools during the upcoming fall veto session. |
| |  Iowa, Illinois back-to-school tax holidays offer savings on clothes, suppliesDiscover how back-to-school tax holidays differ in Iowa and Illinois so you can maximize your savings on clothing, shoes, and supplies this August. |
| |  Jo Dee Messina will be in concert at Rhythm City Casino, DavenportJo Dee Messina will perform Saturday, Jan. 30, at Rhythm City Casino, 7077 Elmore Ave., Davenport. Tickets are available here or at The Market at Rhythm City for $44.45-$87.25 (this includes tax and an online/phone ticketing fee, which is waived if you buy tickets at The Market Gift Shop inside Rhythm City Casino Resort.) Venue [...] |
| | Biz Bytes: New faces at CBI Bank&Trust, Dave Herrell appointed to international board and more Quad-Cities economy newsRead about local leaders being appointed to new positions, businesses winning awards and more. |
| |  Tropical Smoothie Cafe opens in MolineThe new cafe serves a variety of items from their menu, and offers breakfast items all day long. |
| | Rock Island and Henry County real estate transactions for August 2, 2026Here are homes sales and property sales in Rock Island County and Henry County. |
| | Tropical Smoothie Cafe opens, bakery and cafe closes, new beauty and wellness spa, and more Quad-Cities business newsTropical Smoothie Cafe opens, bakery and cafe closes, Adonis Beauty and Wellness spa opens, and more Quad-Cities business news. |
| | Quiet start to the new weekAfter a great Sunday, the nice weather will kick off our new week and temperatures will be close to normal. A few showers are possible Tuesday with better rain and storm chances midweek. Here's your full 7-day forecast. |
| |  What would it take to get peptides on the shelf?An FDA advisory panel recently voted to green-light some popular peptides. The decision brought enormous attention to the market for these products — and concerns about the unregulated supply. |
| | Norwegian JokesThis is Roald Tweet on Rock Island.The Swedish immigrants who came to the Rock Island area by the hundreds in the 1880s and ‘90s to work for John Deere… |
| |  This lawyer believes in second chances. Now AI is providing a boostTens of millions of Americans have criminal records that can be barriers to employment. An AI-powered app is helping those eligible to expunge their records at a pace not seen before. |
| | For those with criminal records, AI is breaking down barriers to employmentTens of millions of Americans have criminal records that can be barriers to employment. An AI-powered app is helping those eligible to expunge their records at a pace not seen before. |
| |  Rare photos of ex-Myanmar leader Aung San Suu Kyi give her family hopeKim Aris, son of Aung San Suu Kyi, told NPR THAT photographs of his mother meeting a foreign official gave him "a reason to hope" for the first time since the military coup that ousted her in 2021. |
| | Special Weather Statement until MON 9:00 AM CDTLocally Dense Fog Affecting Morning Commute |
| |  Over 4 million people are no longer receiving food aid amid sweeping changes to SNAPSNAP, also known as food stamps, has seen a rapid and consistent participation decline since last July. The drop comes as the program faces historic cuts and changes. |
| |  How long will the Grateful Dead's songs survive?The Grateful Dead endured an original run of 30 years, but its appeal has survived just as long in a world where the band no longer exists. The question now is not whether the music will continue, but how? |
| |  For Republicans planning post-Trump future, one race in Washington is worth watchingThe primary to replace Rep. Dan Newhouse is a rare opportunity for Washington's Republicans to seek federal office. Candidates representing different wings of the party are testing Trump's influence. |
| |  Israel says it has serious concerns with Hamas disarmament dealPresident Trump announced proposed disarmament deal with Hamas last week. Israeli strikes overnight and into Sunday evening killed at least 17 people, including children, in Gaza. |
| |  South Korea ditches 'denuclearization-first' strategy. What will Pyongyang do next?South Korea is moving away from its policy of prioritizing the immediate denuclearization of North Korea. But despite that shift, experts doubt Pyongyang will return to the negotiating table. |
| |  U.S. dollar weakens sharply against the Japanese yen after market interventionsThe U.S. dollar weakened sharply Monday against the Japanese yen after U.S. President Donald Trump and Japan's finance minister confirmed both sides had intervened in markets. |
| |  Todd Blanche rescinds Trump's 'anti-weaponization fund' ahead of nomination hearingActing Attorney General Todd Blanche issued a formal order late Sunday terminating President Donald Trump's $1.8 billion "anti-weaponization fund" to compensate his political allies. |
Sunday, August 2nd, 2026 | |
| |  A blaze on an Indonesian passenger ferry leaves at least 5 dead and dozens missingAn Indonesian ferry carrying 271 people has caught fire in waters off Madura island, killing at least five people and leaving 41 others unaccounted for, authorities said |
 | Ducted or Ductless: Improve Home Comfort with an All-Climate Heat Pump(Feature Impact) Making your home a comfortable, welcoming place starts with the choices you make about heating and cooling it. If you're looking to upgrade your system, it may not require a complete overhaul of your existing HVAC setup to add a modern heat pump. Ducted heat pumps can often be installed using a home's existing ducts - and in some cases, it might make sense to combine ducted and ductless equipment. It all depends on the needs of your space. To figure out what factors you should take into account while planning your HVAC system revamp, consider this guidance from the heating and cooling experts at Mitsubishi Electric Trane HVAC US (METUS), leading providers of all-electric, all-climate heat pumps in the U.S. How Heat Pumps Can Work with Existing Ductwork Similar to traditional HVAC systems, ducted heat pumps are designed to distribute conditioned air through ductwork. Therefore, if your home is already set up with a usable duct system, adding a heat pump and air handler could allow you to heat and cool your home more efficiently and comfortably. Depending on the condition, size and layout of your ductwork, you may just need minor modifications during the installation process. Getting a professional home assessment with a qualified HVAC contractor can help you evaluate your options. Because no two spaces are the same, they will assess the design and condition of your existing system, evaluate whether it can support a modern heat pump and identify other potential opportunities for improvement. Why You Can't Use the Same HVAC Approach for Every Home Every home is different, so there's no such thing as a one-size-fits-all HVAC solution. If you have certain rooms that consistently make you shiver or sweat when you walk into them - no matter how comfortable the rest of the house is - that's probably a space your ducted system isn't equipped to reach on its own. Commonly, these are additions that weren't included in the original HVAC design, rooms at the end of long duct runs or areas of the home with different airflow and insulation conditions. Finished basements, for instance, often stay naturally colder than the rest of the home since heat rises and basement walls are cooled by the surrounding earth. Converted attics or bonus rooms above garages, meanwhile, can become extra hot in the summer and cold in the winter. Sunrooms and rooms with large amounts of glass are typically less insulated and experience extreme temperature shifts. When to Combine Ducted and Ductless Systems A combined approach may make sense when you have spaces with different heating and cooling needs. By leveraging existing ductwork in the main areas of your home, you can install a ducted heat pump to keep your most-used living spaces comfortable without extensively reconfiguring your HVAC setup. Spaces outside the main zones can be more difficult to keep climate-controlled using ducted systems alone. Additions, sunrooms, finished basements and converted attics or garages are good places to add ductless indoor units to help manage temperatures. Combine ducted and ductless solutions in a sustainable way by choosing energy-efficient models like Mitsubishi Electric's all-electric, all-climate heat pumps. Integrate a ducted air handler into your existing whole-home system to control the bulk of heating and cooling then install wall-mounted ductless units as needed to provide targeted, on-demand comfort in areas that are more difficult to heat or cool. The heat pumps are designed for high performance in a wide range of temperatures and conditions while remaining quiet, adaptable and energy efficient. Benefits of Combining HVAC System Types If you have a house where it feels like some rooms are always too hot or too cold, a combined ducted and ductless system can help you maintain more consistent temperatures throughout your home. They also give you more control over temperatures in different spaces, since you can adjust individual units rather than changing a single thermostat. Plus, if you know your home needs HVAC upgrades, choosing a combined system means you can make those changes with minimal disruptions to your existing setup, saving you time and money. Learn more about all-electric ducted and ductless heat pump systems at MitsubishiComfort.com. |
| | If You're Feeling Stressed by Pricey Meds, Pharmacists Can Help(Feature Impact) If your wallet is feeling the squeeze of prescription drug costs as other living expenses like grocery and energy prices rise, you're not alone. More people are worrying about affording essential medications these days. In fact, more than 40% of adults said they skipped doses or didn't fill prescriptions in the past year due to cost, according to a KFF Health survey. People who take multiple drugs to manage chronic conditions often feel this pinch even more severely. They're also more likely to make more frequent visits to their clinic or health system for care. That's where a powerful ally can help them manage their drug costs: a health-system pharmacist. These medication experts work side-by-side with the clinicians who prescribe drugs in health care practices - and sometimes prescribe medications themselves. Their deep knowledge can help people get the most out of the drugs they take. "Pharmacists really know the full picture of medications, including pricing, insurance coverage, alternative therapies and potential side effects," said Lindsey Amerine, PharmD, chief pharmacy officer for the Cleveland Clinic. "That's why it's helpful to not only count on your doctor to diagnose your condition and prescribe therapies, but also your pharmacist to optimize your medications." Get a Comprehensive Review of Your Medications Asking the pharmacist on your health-system care team to go over your medications may reveal opportunities to save, Amerine said. Health-system pharmacists are uniquely qualified to provide this service because they keep close track of medication costs as well as approvals of new drugs and how those compare to older options. A full review might reveal: Drugs once needed may not be as useful anymore. People often continue taking medications unaware that something new could offer greater benefits or their condition no longer requires the same therapy. Changes in your condition may mean you could safely take a lower dosage of a drug, thereby reducing costs. There may be less costly alternatives that would work as well such as a generic or older medication. Get Help Exploring Discount Options You've probably heard about programs that can help lower prescription costs, including discount and patient assistance programs. Pharmacists can help you understand how to navigate these programs and access potential discount programs and opportunities, Amerine said. Here's how: Pharmacists can guide you through discount programs your health system offers. They can check your eligibility for drug maker discounts and help you understand how those discounts work with your insurance, especially if you have a high-deductible plan. Pharmacists can help you navigate the various prescription cost-savings programs and how they work. They can also help you learn about patient assistance programs that provide free or discounted medications to people who cannot afford them. Medications are a vital part of your health care. Before you try to stretch a costly medicine or give it up altogether, talk to the medication expert on your health care team: your health-system pharmacist. For more information, visit yourpharmacist.org. Why It Pays to Talk Meds with a Pharmacist "My doctor prescribed it, so I must need it." Often this is true, but not always. People sometimes take drugs longer than they need to, at doses higher than necessary or that may interact with other medications. Just as you'd see a heart specialist about an odd pulse rate, it can help to see a pharmacist - your medication specialist - to discuss your prescriptions. Of all health care professionals, pharmacists have the deepest knowledge of drug interactions and safety issues. They're experts on how the effectiveness of different medications - brand name and generic - compare. They also closely track changes in prices and know when a drug's cost has dropped or if an effective, less costly alternative is available. Health-system pharmacists' expertise is especially helpful for those with multiple chronic conditions who typically take several medications with more benefits, costs and side effects to balance. Talking with a pharmacist can ensure your prescriptions are best for you and that you have access to the most affordable options. |
| | Convenient, Crave-Worthy School Day Recipes to Get Kids Eating Healthy(Feature Impact) During the rush of back-to-school season, parents need quick, efficient options to encourage healthy foods for their families without fielding moans and groans. That means choosing simple recipes that feature nourishing fruits, vegetables, proteins and healthy fats while still boasting kid-approved textures and flavors. Keeping high-quality fresh produce in your kitchen, like Dandy Celery from Duda Farm Fresh Foods, means you'll be ready to whip up nutritious yet convenient lunches, after-school snacks and dinners at a moment's notice. This Ants on a Log Salad recipe is a deconstructed mix-and-eat twist on a classic childhood favorite, while the Quick-Pickled Celery and Egg Salad elevates traditional egg salad into a fresh, tangy filling for sandwiches and wraps. Both recipes are creamy, crunchy and craveable with a well-balanced mix of nutrients to satisfy the appetites of busy families. "Healthy eating doesn't have to be complicated," said Nichole Towell, senior director of marketing and new product development at Duda Farm Fresh Foods. "During the busy back-to-school season, simple choices like keeping fresh celery on hand can make it easier to build wholesome snacks and meals throughout the week. Its crisp texture, refreshing taste and versatility make it a favorite for families looking for easy ways to add more vegetables to their day." Find more easy school-day recipe ideas at DudaFresh.com. Ants on a Log Salad Total time: 5 minutes Servings: 1 1 apple, chopped 2 stalks Dandy Celery, chopped 3/4 cup non-dairy yogurt 2 tablespoons raisins 1 tablespoon peanut butter Chop apple and celery into small, evenly shaped, bite-sized pieces. Add apple and celery pieces, yogurt, raisins and peanut butter to jar and shake well to combine or mix together in bowl. Serve. Quick-Pickled Celery and Egg Salad Prep time: 15 minutes Cook time: 10 minutes Servings: 3 Quick-Pickled Celery: 1/3 cup hot water 2/3 cup white vinegar 1 tablespoon granulated sugar 1 teaspoon salt 1/2 teaspoon whole peppercorns 1 1/2 cups sliced Dandy Celery, cut into 1/4-inch pieces (about 3 celery ribs) 1 sprig fresh dill Egg Salad: 6 large eggs cold water 1/3 cup mayonnaise 1/3 cup chopped pickled celery 1 green onion, thinly sliced 1 teaspoon yellow mustard 1 teaspoon hot sauce 1 tablespoon chopped fresh tarragon 1/4 teaspoon celery salt seasoning To make pickled celery: Use microwave or kettle to bring water to boil. Pour into large mason jar; add white vinegar, sugar, salt and peppercorns. Stir well to dissolve salt and sugar. Add celery and dill. Cover with lid and chill 1 hour to overnight. To make egg salad: Add eggs to medium saucepan and fill with cold water until eggs are covered. Over medium-high heat on stovetop, bring to boil. Turn off heat and cover with lid. Let sit 10 minutes. Drain and add eggs to bowl full of ice-cold water. Chill at least 10 minutes before peeling. Chop hardboiled eggs and add to mixing bowl. Add mayonnaise, pickled celery, green onion, mustard, hot sauce, tarragon and celery salt then stir to combine. Serve in sandwich or wrap, or with crackers. |
| | Teach and Inspire Your Kids by Exploring History as a FamilyTeach and Inspire Your Kids by Exploring History as a Family (Feature Impact) During back-to-school season, education is naturally at the forefront of most parents’ minds. While a lot of important learning is accomplished in the classroom, there are so many opportunities to continue challenging and developing children’s minds and hearts in family life as well. Learning about history together is a practical way to inspire deep, meaningful conversations about the world, whether from books, documentaries or visits to museums. Watch this video to learn more Now is an opportune time to explore the story of Anne Frank, a Jewish teenager evading Nazi capture during the Holocaust. Families can read her famous diary together then visit “Anne Frank The Exhibition,” presented by the Anne Frank House at the Griffin Museum of Science and Industry. This comprehensive exhibition immerses visitors in the context that shaped Frank’s life, from her early years in Frankfurt through her tragic death and how her father ensured her legacy. The centerpiece is the first full-scale recreation of the Annex where the Frank family and four other Jews hid during the Nazi occupation of the Netherlands. The exhibition, recommended for visitors ages 10 and older, is open through early 2027. No matter what piece of history families choose to delve into together, they should take the time to discuss with their kids what they’re thinking and feeling about everything they’re discovering. Then together they can figure out what lessons from the past can be taken into the future. “Anne Frank ’s story is a powerful reminder of what happens when fear and hatred are allowed to take root,” said Dr. Chevy Humphrey, Griffin Museum of Science and Industry president and CEO. “At the same time, it reveals the quiet but enduring strength of curiosity, creativity and resilience, values that sit at the heart of our mission. We hope this exhibition offers meaningful moments of reflection for our guests, particularly young people, and encourages them to think critically about their role in the world they are inheriting.” Learn more about the exhibit and other experiences that bring history and science to life at GriffinMSI.org. |
| | A Leftover Loss: How Americans are Wasting Food and How to Break the Habit(Feature Impact) Leftovers are getting left behind, even as Americans have good intentions about eating them. In fact, there's likely a container sitting in your refrigerator right now. To help families tackle this everyday challenge, Frigidaire's new AI-powered recipe assistant, Frankie, helps transform ingredients already in your fridge into fresh meal ideas. New research from Frigidaire shows just how widespread the leftovers dilemma has become: While 86% of survey respondents say they like or love leftovers, 74% admit they toss them out at least once a week. It adds up: According to the USDA, the average American family of four wastes roughly $1,500 annually on uneaten food. Despite having ready-made meals in the fridge, many Americans are opting for convenience. The research found that 90% of Americans admit to having chosen takeout, delivery or a drive-thru, even when they knew a perfectly good meal was waiting in their fridge. Common Reasons for Wasted Leftovers More than 50% of respondents said the No. 1 reason they throw out leftovers is simple: They forgot about them. Food gets pushed to the back of the fridge, effectively disappearing until it's too late, leading to concerns about freshness and food safety. Waste Feels Personal Respondents say their intentions are good, with 64% claiming to save leftovers to reduce food waste and 52% aiming to save money. In fact, 40% say finishing leftovers feels more rewarding than cooking a meal from scratch or ordering takeout. Still, good intentions aren't good enough. Leftovers are still forgotten and thrown out, often leaving people feeling guilty. With grocery prices and dining costs climbing, 70% say food waste now feels more frustrating or guilt-inducing than it used to. Make the Most of Leftovers Visibility plays a key role in reducing waste. More than 37% of respondents say better fridge organization - simply being able to see leftovers - would help them waste less. However, remembering leftovers is only part of the solution. That's where Frankie, Frigidaire's AI-powered recipe assistant, comes in. Designed to help families make the most of what's already in their refrigerators, the tool generates personalized recipes using ingredients users already have on hand, including leftover meals. Simply enter what you have on hand, along with preferences like cuisine type, number of servings and available cooking time, and it generates step-by-step recipes in seconds. The result is less food waste, more delicious meals and greater value from every grocery trip. To learn more about AI-powered meal solutions, visit Frigidaire.com. |
| | Add 2 Key Nutrients You Might Be Overlooking with an Easy Avocado RecipeAdd 2 Key Nutrients You Might Be Overlooking with an Easy Avocado Recipe (Feature Impact) While everyone is talking about protein these days whether watching their weight or managing type 2 diabetes, fiber and healthy fats are nutrients many people are overlooking. The latest reports show most Americans already meet or exceed recommendations for protein while nearly all (about 95%) do not eat enough fiber, and many people consume too much saturated fat versus unsaturated fat, according to the 2025 Dietary Guidelines Advisory Committee. Prioritizing ways to get more fiber and healthy fats on your plate could be key to managing weight and type 2 diabetes goals this summer. One food that makes it easier to invest in your health, according to nutrition experts: avocados. A growing body of research and materials from Avocados – Love One Today, a science-based resource, suggests fresh avocados offer weight management benefits, help with type 2 diabetes management and are good for blood sugar management. Avocados uniquely contain fiber and healthy fats in each nutrient-dense bite, which slows digestion, helping you feel satisfied and fuller longer. To explore evidence-based avocado nutrition information, along with practical tips and easy recipes, visit Avocados – Love One Today, a leading resource for avocado nutrition information. Try this recipe for Avocado and Blueberry Chia Pudding for your next breakfast or snack. Watch video to see how to make this recipe! Avocado and Blueberry Chia Pudding 1 1/2 cups plain, unsweetened soy milk (or milk of choice) 1 ripe, fresh avocado, halved, pitted and peeled 3/4 cup frozen blueberries 1/2 cup unsweetened vanilla Greek yogurt 1 tablespoon maple syrup 1/3 cup chia seeds To Serve: 1/3 cup granola 1/3 cup fresh blueberries 1 kiwi, chopped 1/2 fresh, ripe avocado, halved, pitted, peeled and choppedIn blender, puree soy milk, avocado, blueberries, yogurt and maple syrup until smooth. Pour mixture into storage container or bowl and add chia seeds. Whisk well to combine. Cover with lid or plastic wrap and refrigerate 4 hours or overnight, until thickened.To serve, divide into bowls and top with granola, fresh blueberries, kiwi and avocado. Notes: Use any milk (dairy or non-dairy) that you prefer in pudding. Use fresh blueberries or conventional frozen blueberries. Other topping options include: nuts, seeds, hemp hearts, sliced banana or strawberries, or nut butter. |
| | TikTok rental scam costs family over $1,000 in East MolineA family moving from California to East Moline fell victim to a TikTok scam, losing more than $1,000 and being left temporarily homeless. |
| | Big River Brass Band closes season with Wycliffe GordonThe Big River Brass Band wrapped up its summer season with a free concert at St. Paul Lutheran Church in Davenport, featuring Wycliffe Gordon. |
| | Family loses over $1,000 in TikTok rental scamA family moving from California to East Moline lost more than $1,000 in TikTok scam and was left temporarily homelessness. |
| |  'House of the Dragon,' Season 3, Episode 7: Red in tooth and claw (and wing and tail)Dragon-on-dragon violence! |
| | Death Notice: Helen StubbeA funeral service for Helen Stubbe, 98, of LeClaire, formerly of Pleasant Valley, will be held at 11 a.m. Wednesday, Aug. 5, at Trinity Lutheran Church, Pleasant Valley. Visitation will be one hour prior to the service on Wednesday at the church. Burial will be in the Pleasant Valley Cemetery. McGinnis-Chambers Funeral Home, Bettendorf, is assisting the family with arrangements. Mrs. Stubbe died Friday, July 31, 2026, at her residence. Memorials may be made to Trinity Lutheran Church of Pleasant Valley. Online condolences may be made at www.McGinnis-Chambers.com. A full obituary will appear in the Aug. 5 edition of The NSP. |
| |  Pop-up market features local youth entrepreneursThe market gave kids ages 6 to 17 a chance to sell their items locally. |
| | Clinton County sheriff warns of celebrity romance scams after local caseThe Clinton County Sheriff's Office is warning about celebrity romance scams after a local woman lost $5,000 in gift cards to someone posing as a Netflix actor. |
| | Touch-A-Truck event brings families to MilanFamilies explored fire trucks, police vehicles, ambulances and heavy equipment during the free Touch-A-Truck event at Camden Park, hosted by Quad-City Fire Wire. |
| | Last minute rain to make a very average JulyAfter a record-breaking amount of rain on Friday where we received the most rain for July 31st at 1.87", it brought us right where we should be for the month. Where average July rain totals are around 4.23" of rain, that last minute rain on Friday brought us to 4.31, just barely meeting the mark [...] |
| |  Illinois bell-to-bell cell phone ban: Local schools prepare for 2027 deadlineIllinois public school students will soon be required to put phones away all day under a new bell-to-bell ban signed by Gov. JB Pritzker. Here's what local districts are saying. |
| |  Neighbor keeps Davenport fire victim’s memory alive through lawn careNearly two months after a house fire claimed the life of Davenport resident Mark Frick, one neighbor is making sure his memory lives on—one mow at a time. |
| | Rock Island Brewing Company says it is reorganizing operations, not closingRock Island Brewing Company says it is not closing permanently and is reorganizing its hours while continuing to host special events and offer online food delivery. |
| | A look back at Jon Diaz's most memorable interviews | News 8 This Week - Aug. 2, 2026In this special episode, John revisits standout conversations with a World War II veteran, Rock Island Arsenal Museum leaders, local authors, and more. |
| | Jo Daviess County deputies arrest suspect in Elizabeth burglary investigationA man was arrested after Jo Daviess County sheriff's deputies said he entered two homes in Elizabeth in separate residential break-ins. |
| |  Capital One says it closed Trump Organization accounts over money-laundering concernsThe bank is asking a judge to permanently dismiss a lawsuit from Trump-affiliated businesses, arguing a monthslong internal review — not the Jan. 6 riot — explains why hundreds of accounts were shut down in 2021. |
| | Spider-Man debut crashes VIP Moline websiteThe new Spider-Man movie is on track for a $260M to $280M domestic opening weekend, with moviegoers filling seats at VIP Theatres in Moline. |
| |  Thousands of people under evacuation order from wildfires in Spokane, Wash.There are at least three fires in and around the city. Large parts of Spokane are under Level 3 evacuation orders, which read: "Leave NOW! This may be your only notice." |
| |  Chris Crozier joins CBI Bank & Trust as Senior Vice President, Chief Technology Officer“We look forward to the experience and leadership he will bring to CBI Bank & Trust.” |
| |  New video evidence upends the unsolved killing of a Black teen at a Seattle protestHours of video analyzed in an 18-month investigation reveal what really happened the night Antonio Mays Jr. was shot at the Capitol Hill Occupied Protest, and how protesters mistook him for a threat. |
| | A teen was killed at a Seattle protest. New video evidence shows what really happenedAn 18-month investigation by The Seattle Times, KUOW and NPR's Embedded podcast and a review of more than a dozen videos from the night of the shooting reveal the most comprehensive view to date of how the chaotic scene unfolded. And they show how a Black teenager who came to join the civil rights movement of his generation — in a zone abandoned by police — ended up killed by a protest movement that thought he was a threat. |
| |  The Clothing Co., in LeClaire, to hold grand re-opening in new homeThere will be special giveaways throughout the day during the celebration. |
| |  Iowa Quad-Cities school districts split on allowing 8th graders to play high school sportsIowa Quad-Cities school districts are weighing a new Iowa law allowing eighth-graders to play high school sports, with varying restrictions and concerns. |
| |  UnityPoint Health – Trinity first robotic treatment for enlarged prostateUnityPoint Health – Trinity introduces the region’s first robotic treatment for men with enlarged prostate. |
| | MARK-TO-MARKET: The cost of taking your family to a Major League Baseball gameFor a family of four, the total cost varies extensively from one Major League ballpark to the next. |
| | What's next in the case against Jamison FisherIt's been almost 30 years since Trudy Appleby disappeared. Now witnesses point to the man they say took her. |
| |  Why is the rate of premature births so high in this community?About 1 in 4 babies in the Pakistani fishing settlement of Rehri Goth are born prematurely. Researchers are trying to figure out how to bring the numbers down. |
| |  Bettendorf City Council will discuss Criswell annexation Monday. Here's what they've saidThe plan would cost the city an upfront $15 million in sewer installation. But, the city believes it could recoup that cost in additional sewer fees and general fund revenue. |
| |  12-year-old farmer keeps Davenport fed with fresh produceI just get up in the morning, go to work, I come back, and then this is what I do in my off time," Jaxon Songer said. |
| | A Cat StoryThis is Roald Tweet on Rock Island.You may have heard of Huckleberry Finn who once lived a hundred miles or so downstream of Rock Island. Huck never told… |
| |  The Clayton Sisterhood Project: A photographer captures her family's reverse migration from North to SouthLaila AnnMarie Stevens documents her family's move from New York City to North Carolina — a kind of reversal of the historic Great Migration of the early 20th century. |
| |  We asked a first grader to interview his hero: A bird scientistNPR asked an aspiring scientist in Philadelphia to interview an adult who is living his dream about his career in conservation science. |
| |  What Cyclospora does inside the gut and how it gets thereCyclospora, the parasite that has sickened thousands this summer in the U.S., requires time in the human digestive tract to reproduce. |
| |  Idaho fast food restaurant shooting leaves 3 dead, city spokesman saysPolice who responded to the shooting found the body of the suspected gunman in an area near the restaurant. |
| |  Trump says he's cancelling Iran strikes, deal pendingTrump said that Iran and other Middle Eastern countries had asked the U.S. "to hold off any attack" on Iran because "the perimeters of a deal has been agreed to." |
Saturday, August 1st, 2026 | |
| |  Former TV6 Sports Directors reflect on Roger Craig’s Hall of Fame enshrinementFormer sports directors Tom Korun and Thom Cornelis both covered Roger Craig during his time at Davenport Central and recalled recognizing his talent early. |
| | 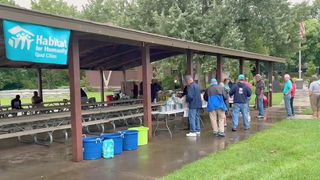 Habitat for Humanity Quad Cities brings volunteers and families together for reunionSince 1993, Habitat for Humanity has dedicated homes throughout the QCA, and rain couldn't keep volunteers and those helped by Habitat for Humanity away for a reunion. Habitat for Humanity Quad Cities helps make affordable homeownership a possibility as the homes foster strength, stability and self-reliance for partner families. For more information about Humanity Quad [...] |
| |  Davenport man pleads guilty in sex abuse and possession of child sex abuse materials casesHe will have his prison sentence capped at 40 years after entering into a plea deal in a sex abuse case and possessing child sex abuse materials. |
| | 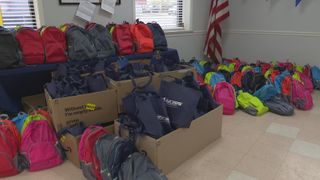 Quad Cities Jaycees pack 180 backpacks, 133 hygiene kits ahead of new school yearA Quad Cities nonprofit assembled hundreds of school supply packages for local students ahead of the upcoming school year, with volunteers filling 180 backpacks and 133 hygiene packs to be distributed across Quad City school districts. |
| |  Store owners near Muscatine demolition site feel the pinch of slower customer trafficBusiness owners near the demolition on Muscatine's Second Street feel the pinch of slower customer traffic. Residents worry about downtown’s future. |
| | Quiet days after much-needed rainA few days of sunshine are expected across the Quad Cities after the soaking rains of Friday and Saturday. Heavy rain closed out July and kicked off August. Here's your full 7-day forecast. |
| | 2 downtown Muscatine buildings collapse overnightTwo vacant downtown Muscatine buildings collapsed, sending debris into the street and raising concerns about the stability of neighboring structures. |
| | 2 downtown Muscatine buildings collapseTwo downtown Muscatine buildings collapsed, raising stability concerns for neighboring structures. |
| | RIBCO says closure is temporary amid reorganizationRIBCO says it's reorganizing hours, not closing for good. It will stay open for Alternating Currents, special events and online deliveries. |
| |  Iowa vape registry law upheldIowa Attorney General Brenna Bird touted a recent court win for her office. Iowa won a lawsuit that vacates the injunction preventing enforcement of Iowa's vape registry law. House File 2677 created an official state directory to regulate the distribution and sale of vapor products in Iowa by creating a directory of approved vapor products. [...] |
| |  Fungal disease impacting corn crops hits IowaIOWA -- More cases of a destructive fungal disease have been found in Iowa corn crops. Iowa State University Extension and Outreach announced last week that cases of southern rust were confirmed in Benton, Mahaska, Muscatine and Louisa counties on July 21. On Friday, the Crop Protection Network map shows cases have been found in [...] |
| |  Puppy love! Six litters now in QCA foster careSix litters of puppies are now in foster homes and under the care of the Quad City Animal Welfare Center. Our Quad Cities News photojournalist Gabe Zwierzynski spoke with a woman fostering one of those litters and found what all it will take to get the puppies ready for adoption. For more from the Quad [...] |
| |  Moline man charged with allegedly using AI to create child sex abuse materialsA Moline man is charged with allegedly creating child sex abuse materials using artificial intelligence. |
| |  Davenport man sentenced to 17 years in prison in four felony casesHe was sentenced to 17 years in prison after pleading guilty in two shooting cases, as well as to eluding and being a felon in possession of a firearm. |
| |  Overnight Russian barrage kills nine in Kyiv, as air defense struggle with U.S. continuesBallistic missiles tore into five districts of the Ukrainian capital before dawn Saturday. President Trump is now walking back a promised boost to Ukraine's missile defense systems. |
| | Illinois FRESH Program gives one-time payments to people who lost SNAP benefitsThe program is aimed at people who couldn't qualify for new federal work requirements to continue receiving SNAP benefits. |
| | Death Notice: James WeibelA memorial service celebrating the life of James L. Weibel, 82, of Long Grove, will be held Monday, Aug. 10, at 10 a.m. at Chambers Funeral Home, Eldridge. Visitation will be Sunday, Aug. 9, from 2-5 p.m. at the funeral home. Mr. Weibel died Tuesday, July 28, 2026, in DeWitt. Memorials may be made to the Salvation Army, Humility Homes & Services or to a charity of the donor's choice. Online condolences may be made at www.McGinnis-Chambers.com. A full obituary will appear in the Aug. 5 edition of The NSP. |
| |  Spain's Pedro Sánchez was a hero of migrants. After Ceuta, he faces his biggest challengeThe pro-immigration leader is facing backlash at home and abroad after roughly 60,000 people crossed from Morocco into the Spanish enclave. |
| |  OneTable QC to host free workshop on nonprofit burnoutOneTable QC will host a free community event on Aug. 4 exploring new research on nonprofit burnout and fortitude, featuring nationally recognized leadership and healthcare experts. Registration is required due to limited seating. |
| |  Girl reported missing in Scott Co. found, deputies confirmThe Scott County Sheriff's Office confirmed the news on Saturday. |
| |  2 downtown Muscatine buildings collapse overnightCity officials confirmed it happened just before midnight. |